
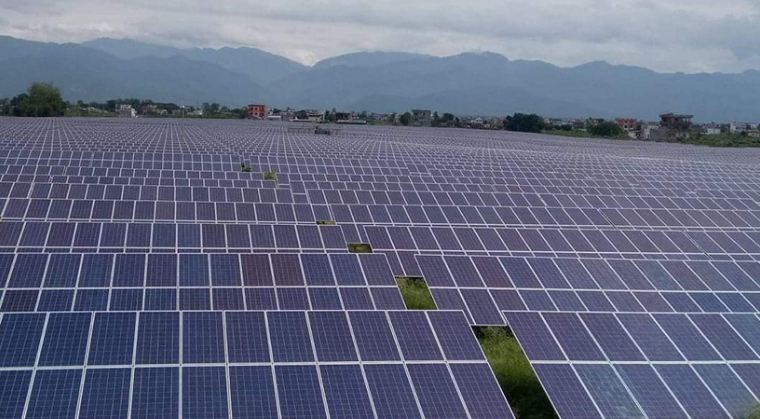
June 2021 - Smart Solar Nepal

A Basic Insight into Solar Farm

With the advancement in Science and technology, mankind has exploited the resources available at its disposal. To meet the ever-increasing energy demands, different energy harnessing mechanisms have been developed such as Hydro power plants, Thermal power plants (include Coal plants, Diesel plants), Nuclear power plants. Fossil-fuel powered plants have been used for well over a century as the main source of energy around the world. Emissions from fossil-fuel powered plants are detrimental to the environment producing greenhouse gases which are the main cause of global warming. So, the world is attempting to move on from fossil-fuels to a more sustainable form of energy. Solar energy, being the most abundant form of energy, could be the answer to the existing energy demands and environmental pollution.

The development and improvement in solar technology has resulted in significant increment in the efficiency of solar cells from about 8% in the past to about 15-20% at present. This improvement has allowed the extraction of more solar energy at cheaper rate. In recent times, the world focus is on the extraction of solar energy at a commercial scale that could compete with the existing fossil-fuel powered plants. One of those methods for mass solar energy extraction is Photo Voltaic Solar Farm. 

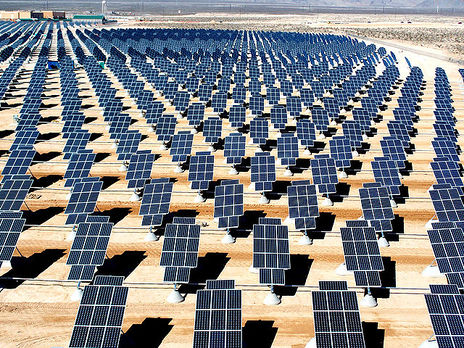
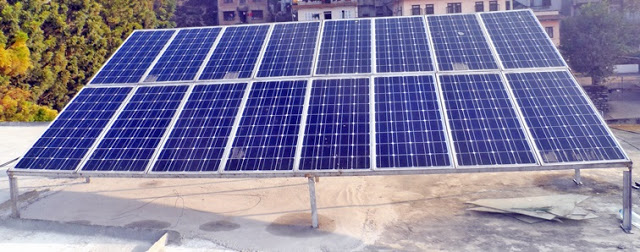
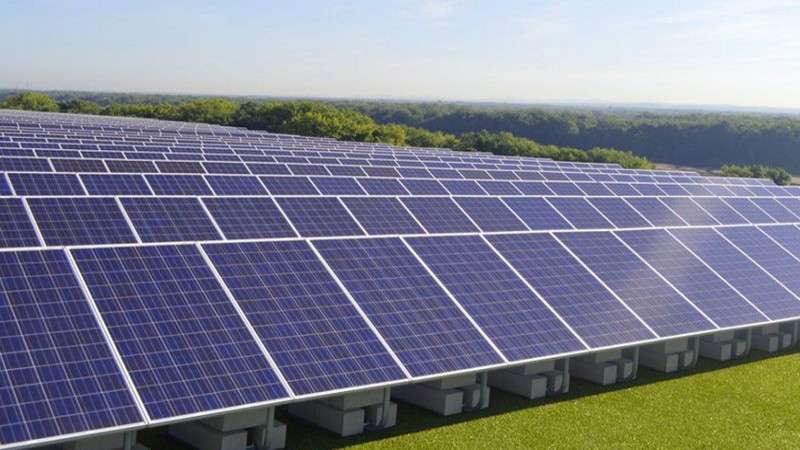
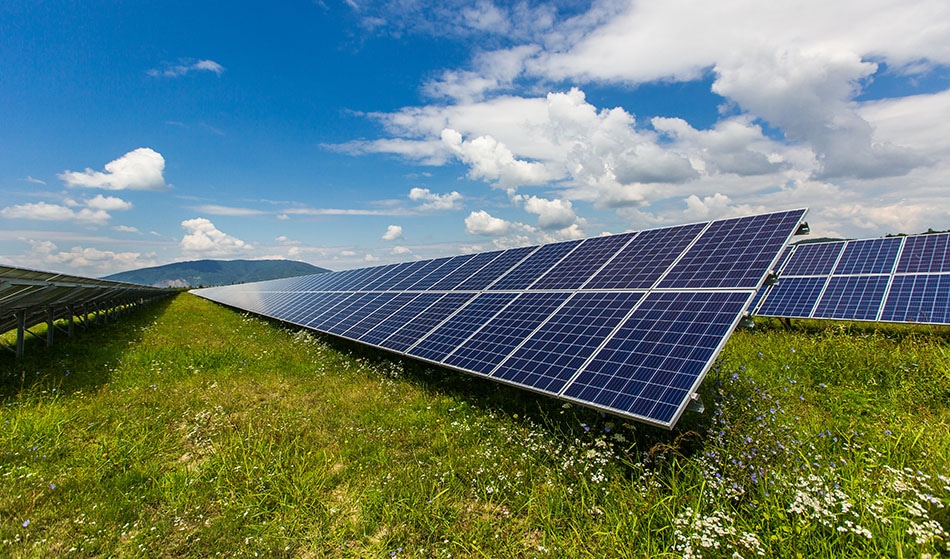
 Solar farms are large-scale, ground-mounted solar installations. They use photovoltaic (PV) panels or other means of collecting solar energy, like concentrating solar systems, to harness the sun’s power. Solar farm typically consists of interconnected solar panels placed on acres of land or on the surface of lake, racking, cables, inverters, transformers, and a power line or substation to deliver the power to the electric transmission grid. Since, utility-scale solar farms have capacity in megawatts, they operate in day time only and are shut at night with no power backup. For the construction of Solar farm, at first, the location is studied and surveyed for higher solar irradiance. The location selected can be desert, land or surface of lake. The land is then, leased for a period of about 25-40 years. The land leased for solar farm are generally uncultivable or barren.  The construction process is simple i.e., just the installation of solar panels, inverters and transmission lines and could be completed in matter of months. However, the government regulations, paperwork could pose some setback in time. The cost of Operation and Maintenance of solar farm is comparatively low than that of other Plants due its simple design and static components. The O&M period is generally 3 to 4 times a year.
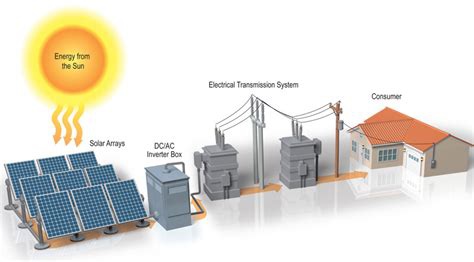
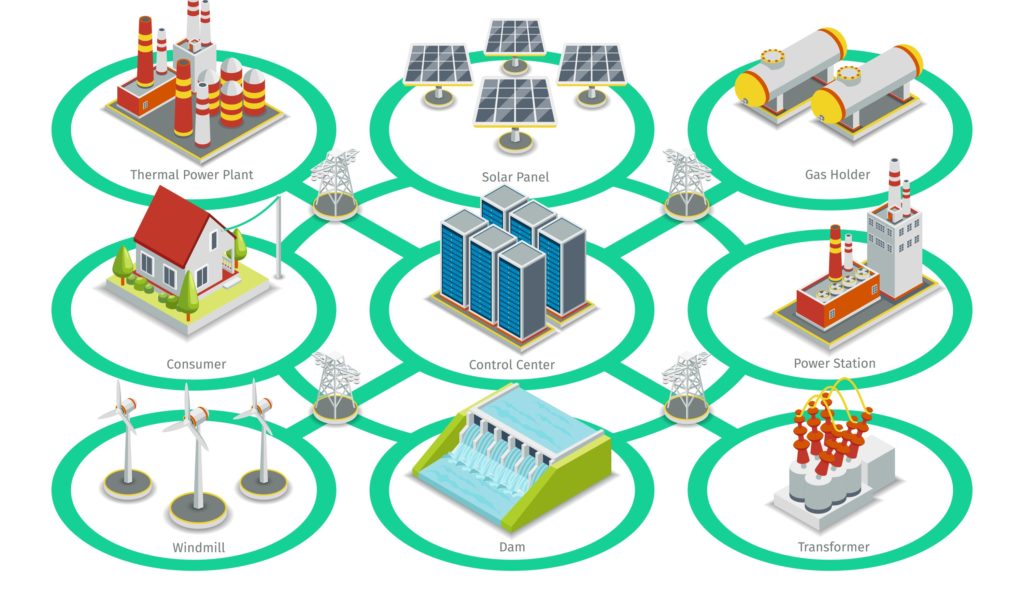
Schematic diagram of Solar Farm

Types of Solar Farm:

Based on the capacity of Plant and the consumers it serves; solar farms can be categorized in two types:

  • Utility Scale Solar Farm:

Utility Scale Solar Farms are mega projects with generation capacity ranging from 1MW to 2GW. They typically cover hectares of land which are generally leased instead of purchase for cost reduction. They serve large number of consumers, typically from 300-500,000 homes depending upon their generation capacity. Energy generated is sold to the utility buyers as per Power Purchase Agreement (PPA).

  • Community Solar Farm:

These solar farms have capacity of about 100KW-5MW. They are built at the vicinity of consumers and provide energy to only those who have paid for the share of power.

Global Status of Solar Farm:

The low cost of PV cells and government subsidy has paved the way for the commercial scale installation of solar farms. The number of Solar farms across the world has surged massively at present times. Moreover, the size of Solar farms has also increased progressively with new record in capacity being made frequently. According to Wiki Solar, the generation of Utility Scale Solar Farm reached 96GWAC by 2016, which represented 1.3% of the total global power.

Some of the largest Solar Farms are listed in tabular form below:

S.No.NameCountryCapacity (MWAC)Size (km2)Year
1.Bhadla Solar ParkIndia2,24557 2020
2.Huanghe Hydro Power Hainan Solar ParkChina2,2002020
3.Pavagada Solar ParkIndia2,050532019
4.Benaban Solar ParkEgypt1,650372019
5.Tengger Desert Solar ParkChina1,547432016
6.Noor Abu DhabiUAE1,1772019
7.Mohammed bin Rashid Al Maktoum Solar ParkUAE1,0132020
8.Kurnool Ultra Mega Solar ParkIndia1,000242017
9.Datong Solar Power Top Runner BaseChina1,0002016
10.NP KuntaIndia9002020

Solar Farm in Nepal

Nuwakot Solar Power Station is the largest solar plant of Nepal. The solar panels are installed in six locations within the premises of Devighat Hydro Power Station owned by Nepal Electricity Authority. Energy generated from the Plant is connected to the 66 kV sub-station of Devighat Hydropower Station.

The construction of Plant is contracted to Risen Energy Co. of China. It is also responsible for Operation and Maintenance of the Plant for first five years from generation time. After the contract expires, the Plant is handed over to Nepal Electricity Authority.

The construction began in 2018 with completion target of 1 year. NEA had planned to install 15MW by April 2020 which was again delayed due to nationwide lockdown to prevent the spread of COVID-19 pandemic. As of June 2020, only 1.25 MW has been installed.
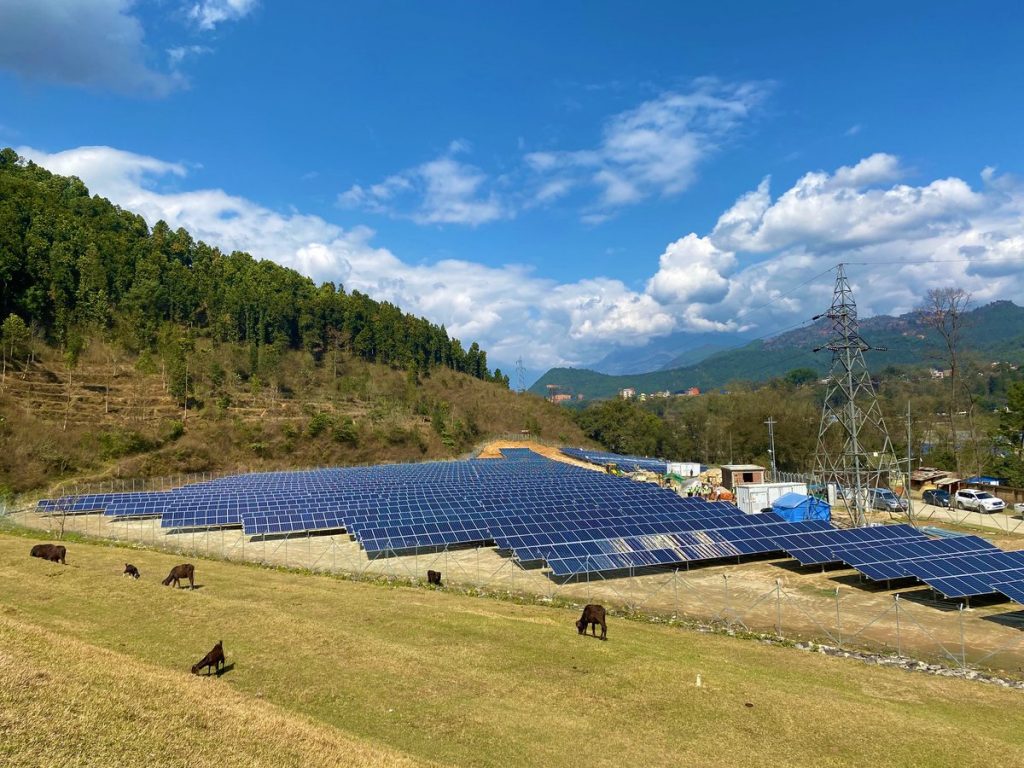
Nuwakot Solar Power Station

Government of Nepal, Ministry of Energy, Water resources and Irrigation, Department of Electricity has issued license for the construction of Solar Farms in different parts of the country, all of which are tabulated below:

S.No.ProjectCapacity (MW)Issue DatePromoter
1.Grid-Connected Solar Power Project, Butwal , 33 kV S/S8.52076-02-14Ridi Hydropower Development Company Ltd.
2.Block No 1 Solar Farms Project5.12076-03-09Nepal Electricity Authority
3.Block No 2 Solar Farms Project8.32076-03-09Nepal Electricity Authority
4.Bel Chautara Solar Farm Project52076-03-18Solar Farm Pvt. Ltd.
5.Mithila Solar PV Power Project, Dhanusa102076-05-06Eco Power Development Pvt. Ltd
6.Som Radha Krishna Solar Farm Project4.42076-07-14Nepal Solar Farm Pvt. Ltd
7.Solar PV Pratappur52076-09-11National Solar Power Company
8.Chandranigahpur Solar Project42076-10-01Api Power Company Pvt. Ltd
9.Bhrikuti Solar Power Project92076-10-12First Solar Developers Nepal Pvt. Ltd.
10.Grid Connected Solar Project Block 4, Nuwakot1.372077-04-12Nepal Electricity Authority
11.Grid-Connected Solar Power Project, Dhalkebar, 33 kV S/S32077-04-25Sagarmatha Energy & Construction Pvt. Ltd.
12.Grid Connected Solar PV Project, Ramgram, Nawalparasi22077-06-11Saurya Bidhyut Power Pvt. Ltd
13.Grid-Connected Solar Power Project, Duhabi, 33 kV S/S82077-06-12Global Energy & Construction Pvt. Ltd.
14.Utility Scale Solar PV6.82077-07-06G I Solar Pvt. Ltd,
15.Solar PV Project Banke, block-2102077-08-29Pure Energy Pvt. Ltd
16.Solar PV Project,Raniyapur, Block 1102077-09-02Pure Energy Pvt. Ltd
17.Grid Connected Solar PV Project, Ganeshpur, Kapilbastu102077-10-2Positive Energy Pvt. Ltd

Total capacity of all 17 projects is estimated to be 110.47MW

Subsidy Suppress the RE Development

In Nepal’s Present Scenario

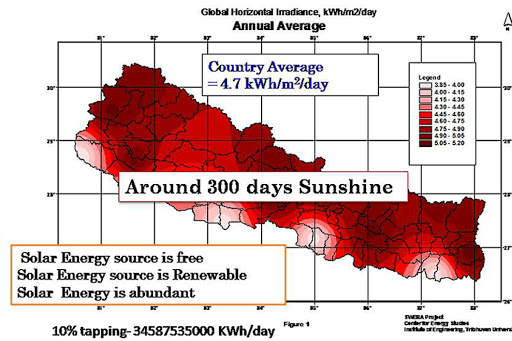
From the twenty-first century onward, solar radiation is the best alternative and most cost-effective energy resource on the planet. Nepal has (4-6) hours of sunlight per day on average, with an average solar radiation intensity of 4.7kWh per square meter, and a commercial capacity of solar power for grid link estimated at 2,100 MW. The Solar and Wind Energy Resource Assessment project tried to map Nepal’s wind resource potential and found a very bright potential for wind energy, with a projection of about 3,000 MW of wind energy.

According to the Nepal Electricity Authority (NEA), approximately 86.44 percent of households in the country now have access to electricity transmitted via the national grid. So, why does renewable energy source for just 3% of Nepal’s electricity mix? It is a controversial topic in the country’s hydro-dominated electricity market, but little action has been taken. In Nepal, Solar panels on individual rooftops are still the main source of renewable energy (RE). Wind power projects are far too few to be anything other than showpieces, while hydropower production is stuck in uncertainty and commitments that have yet to be fulfilled. Despite the fact that electricity has been available in Nepal for over a century, hydropower still produces less than 1,000 megawatts per year, despite the fact that four zeros are typically added to the number.

Subsidy suppress the development

Nepal has established a semi-autonomous agency called the Alternative Energy Promotion Centre in 1996. It has focused on household-level rural energy supply through solar and micro-hydro and promotion of biogas for cooking. But it has failed to upscale RE development at industrial level. Many people blame the country’s subsidy policy, claiming that it does not encourage creativity in the sector and has struggled to attract both domestic and international investors.

In last two and half decades, Nepal’s total RE production has been 50 MW – less than a single medium-level hydro project in neighboring countries. Due to its focus on reaching out to people living in remote mountain areas, the RE policy has a heavy subsidy component. In 2000, the Subsidy Policy and Subsidy Delivery Mechanism were first written. These two documents were updated on a regular basis, with the most recent versions released in May 2016 and November 2016, respectively. The Subsidy Policy acknowledges that previous subsidies failed to efficiently mobilize private investment and commercial credit into Nepal’s renewable energy market. Subsidy dependence has increased rather than decreased. The policy document implied that communities were attempting to obtain subsidies from various outlets. One of the reasons for this was that the electricity tariffs were insufficient to cover the system’s initial investment costs. This isn’t the only explanation, though.

Standard Criteria for the Qualification of Solar PV Modules in the Context of Nepal

The Sun is an infinite source of energy that is pivotal for sustaining life on our planet earth. The energy from the sun can be exploited directly in the form of heat or first converted into electrical energy and then utilized. Accordingly, the solar energy is classified into solar thermal which has low level of dissemination and solar photovoltaics (PV) which is extensively used all over the world.

The solar PV can be considered the only form of electrical energy that can be generated anytime and anywhere provided sunshine is available. Nepal is blessed with solar resource as it lies at about 30◦ Northern latitude which is ideal and there are over 300 days of sunshine annually. Further the annual average solar insolation is about 5kWh/m2 per day.  These conditions are perfect for harnessing solar energy for various conversion technologies.

Selection of Solar PV Modules plays a vital role in determining the fate of any project and Under the influence of Alternative Energy Promotion Centre/ Energy Sector Assistance Programme (AEPC/ESAP), Nepal Photovoltaic Quality Assurance (NEPQA) has been developed which is maintained by Renewable Energy Test Station (RETS).

SPECIFICATIONS OF SOLAR PV MODULES

General Documents

The PV module must be of Crystalline Silicon (Mono Crystalline or Poly Crystalline) or Thin film Type.

Required Documents

IEC certificate of PV module. Model/type of PV module must be mentioned in certificate.

  1. The PV Module must be certified by a Certifying Body Testing Laboratory (CBTL) or National Certifying Body (NCB) enlisted in the IECEE website. The enlisted CBTL or NCB must have scope of PV Testing.
    • Mono Crystalline Silicon PV module and Poly Crystalline Silicon PV module must be tested and certified according to the standard-“IEC 61215 Edition 2 2005-04 (or EN 61215 Edition 2) – Crystalline Silicon Terrestrial Photovoltaic (PV) – Design Qualification and Type Approval”.
    • Thin-film PV modules must be tested and certified according to the standard – “IEC 61646 – Thin-film Terrestrial Photovoltaic (PV) Modules- Design Qualification and Type Approval”.
  2. A letter provided by principal PV module manufacturer in their letter head stating the warranty period for their PV module.  The warranty period for the PV Module must be at least 10 years against a maximum 10% reduction and 20 years against a maximum 20% reduction of output power at STC.
  3. A local importer must provide a document of agreement between the local importer and the principal PV manufacturer, signed and stamped by authorized persons stating warranty period and after sales services for their PV Module. In case of local PV manufacturer, it has to provide document stating warranty period stated in clause (ii) above and after sales services for their module in their letter head signed and stamped by authorized person.
  4. Catalogue and technical specification of PV module.

Technical Requirements

  1. The following electrical parameters of the module will be tested and certified by Renewable Energy Test Station (RETS).
    • Deviation of maximum power from nominal values stated by the manufacturer must be within – 5% and +20% (minus five and plus twenty) at STC. In case of Thin-film type modules, deviation of maximum power will be measured after exposing the PV modules in ambient conditions for two consecutive periods of exposure of at least 43 kWh/ m2 according to IEC 61646 10.19.
    • The maximum power voltage (Vmp) of the PV modules to be used for 12V systems must be at least 17 V at STC.  And for 12X, V system voltage Vmp must be at least 17X, V at STC, where X is a natural number.  For systems different from 12X V, the Vmp of the module at STC must be at least 40% higher than the system voltage.      
  2. Crystalline PV modules of 40Wp or above must have inbuilt bypass diodes. The module will be configured such that strings of maximally 20 cells are bridged by a bypass diode. The Junction box needs not be opened, if the principal PV manufacturer provides an assurance using their letter head about the existence of bypass diodes in the junction box.  
  3. The module efficiency for crystalline module must be at least 10 % for upto 10Wp, 11% for above 10 Wp to 50 Wp, 12% for above 50 Wp to 100 Wp, and 14% for above 100 Wp.
  4. The module efficiency for thin film module must be at least 8% up to 100 Wp and 10% above 100Wp. 
  5. The PV module must carry the following indelible markings:   \
    • Name of the manufacturer 
    • Model or Type No.
    • Maximum rated voltage and current 
    • Open Circuit Voltage and Short circuit current
    • Serial Number of PV Module 
    • For Crystalline Modules, additionally
      • Nominal power in Wp
    • For thin film modules, additionally
      • Nominal and minimum values of maximum output power at STC (i.e., Lowest stabilized power), as specified by the manufacturer for the product type.
  6. Serial Number, model name and brand name must be laminated inside the glass for crystalline modules of capacity up to 100-Watt peak. For panels above 100-Watt peak mentioning of only serial number laminated inside the glass will suffice.
  7. Readable mentioning of serial number, model name/number and brand name is a must for thin film modules. This mentioning can be at the front of the panel or at the back by laser marking on the substrate or engraving on bus-bars.

Recent Development of Batteries used in PV Systems

Overview


Batteries have become an integral part in any P-V (Photovoltaic) systems. Batteries are used in storing the energy produced by the Solar module throughout the day, and supplying the loads at household. The storing of charge ensures there is a continuous supply of electricity even during night when the panels do not produce any energy, or in the period of blackout of grid. Some of the major functions of batteries are listed below:

  • Storage: The primary function of battery is storage, batteries store charges and supply it during need. It can be used to power various loads that are necessary throughout the household, hospitals, industries.
  • Starting current: Another application of batteries is it can be used to supply initial starting current which are used by loads, which require high current to start initially like motors.

Recent battery types used in P-V systems

There are generally two sub divisions of battery, that is 1) Primary battery and 2) Secondary battery, primary batteries cannot be re-charged hence, it is not used in the solar PV systems. Secondary batteries can be recharged for that reason it is widely used in P-V systems.

There are two types of battery system that have been the most popular form of backup system, they are:

Lead acid:  Lead acid batteries has been the most popular option for battery backup system for solar. It has been used in off-grid system for decades, its advantage of being rugged, durable, low cost. Being one of the cheapest systems it has been the chosen battery backup system for developing countries. The disadvantage is it is big and heavy and not environmentally friendly.

Some of the types of lead acid batteries are:

  • SLI batteries: Starting, lighting and ignition are the batteries that is used for shallow cycle services.
  • Motive or traction batteries: it is a popular choice of batteries for a PV system, it has a deep discharge cycle, long life.
  • Stationary batteries: Stationary batteries have same characteristics as both SLI and traction batteries and used in uninterruptible power supply (UPS) to provide backup to loads.

Batteries are used in uninterruptible power supply (UPS) to provide backup to loads.

Lithium-Ion battery: Lithium-Ion battery while primary being developed for consumer electronics, have shifty taken a large chunk of Photo voltaic market in the developed countries, Tesla, LG chem are some examples of companies that have been developing Lithium-ion based solar storage system. Lithium-ion is projected to take over the market of solar because of decrease in cost of Lithium-ion battery every year. The main advantage of Lithium-ion battery over a lead acid battery is that, it has greater Depth of Discharge at 80%, greater energy density and longer lifespan.

There are two core Lithium-ion battery technologies

  • Lithium Iron phosphate (LiFePO)
  • Nickel Manganese Cobalt (NMC)

NMC batteries are better suited for Electric Vehicle application whereas LiFePO is better suited for residential storage application.

Future of batteries

There has been constant improvement on batteries ever since their development, there is always more room for improvement for storage systems, lot of financial resources have been allotted for research in the field of battery, the development works that are being done is either, improvement of previous batteries technologies like Lithium-Ion, or searching for a breakthrough with completely new technology and chemistry. Even though lithium-ion battery technology has been one of the most successful batteries technologies that exists boasting high energy density and great depth of discharge, some experts believe that it may be too expensive for Grid-scale applications, some of the promising technologies are:

  • Lithium- air:  Lithium-air batteries first proposed in 1970 has been a promising alternative for lithium-ion due to the promise of high energy density. Li-Oxygen batteries are being considered due to both elements being light materials and promising of high energy densities.
  • Lithium- sulfur: Although lot ofresearch have been put into the development of Lithium- sulfur, its promise of high energy densities (2000 Wh/kg), there is still a gap between theoretical academia and practical commercialization.
  • Solid-state lithium:  Unlike lithium-ion liquid electrolyte, Solid state battery promise a solid electrolyte which in terms provide longer lifespan and inflammable electrolyte in turn provides a greater environment safety.
  • Flow Batteries:  Flow batteries are suitable for storage application and might as well be used in P-V systems in near future, durability and long lifespan is an attractive feature of these batteries. Flow batteries are based on the principle of Redox and store energy in electrolyte. Some of the flow batteries that are already available are Vanadium redox flow, which has higher cycle life (>10,000) compared to lithium-ion batteries, but they still lack in energy density compared to lithium-ion.
  • Salt water Batteries: Salt water batteries are battery that uses saltwater tostore energy. The attractive traits of this battery are that it has high level of safety and longer lifespan. It is also very eco-friendly as they can be easily recycled. Still this battery needs to have higher energy density it is to compete with lithium-ion technology.
  • Sodium-ion Batteries: Sodium- Ion batteries will use sodium which is a very abundant resources compared to Lithium. Abundance of materials means that the cost would be much cheaper in long run.
  • Graphene Batteries: Graphene batteries are made up of carbon atoms that are tightly bound in hexagonal order, it is promising technology due low weight, high electrical conductivity and high flexibility. Since, graphene batteries allows for higher electrical conductivity than Lithium-Ion it can be charged much faster.

Conclusion

Which of the listed battery technology can be best used for solar backup systems, in grid’s application can be up for debate, but it is crucial we must experiment with new technology to take the battery storage up to grid-scale, up until now pumped hydro has been most common way of storing energy, but we should not limit ourselves to just that technology for the future. Constant innovation on batteries and storage system is key to supply power on demand and not wasting any generated energy, reducing energy wastage is a key to efficient smart cities and it cannot be done unless there is a good backup storage system to store energy.

Practices of Solar Energy: Traditions from Past to Manipulation in Future

Since the life on Earth formed, every living organism that walks, moves or just grows relies on sun. From plants, depending upon sun’s rays for photosynthesis to humans, relying on sun’s energy for their daily activities, everything on this Earth is dependent upon Sun. Not until recently, humans started trying to harness the solar energy more effectively by utilizing the photo-voltaic effect. Even though, the breakthrough was done in 1800s-1900s, more advanced technology has been updated in same subject up until now. Albeit, we have been using other futile method to harness solar energy before 1800s.

Traditions of Tapping by Crude Means

Humans has been utilizing solar energy from its host star, sun, from as far as 7th century, using the science of lens, to burn organic matter using magnifying lens and focusing the sun’s ray. Moreover, Greeks and Romans also used the similar technology in war strategy, burning enemies’ ship. Similarly, homes and bath house used the same technology to heat water tanks.

Evolution of Solar Panels

The photovoltaic effect was discovered by scientist Edmond Becquerel by experimenting with electrolytic cells: electricity was produced by exposing the cells to the sunlight. Eventually, in 1876, William Grylls Adams, a professor at King’s College London and his student, used selenium to convert light into electrical energy. In 1883, New York Inventor Charles Fritts created first solar cell by coating selenium with thin layer of gold. They were used in making world’s first solar array, albeit due to its low efficiency of just 1%, adoption on a wild scale was disbanded due to expensive material cost.

In early 1900s, Albert Einstein published first theoretical work elucidating the photovoltaic effect explaining that light contained packets of energy he called “light quanta”. Using the same work, in 1950s, technology was developed to convert the energy radiating from sun directly into electricity using first silicon photovoltaic cells, or what we call today, solar panels having an efficiency of 4%. One of the first uses of a solar panel was on the Vanguard I space satellite launched in 1958. From then, various research on solar panels were found to be done drastically increasing the efficiency and changing other physical properties of classical PV cells used for energy harvesting of sun. As much as 16% of efficiency was achieved during 1960 by Hoffman Electronics in 1960.

Modern Exploitation

Nowadays, the efficiency of PV cells in harnessing energy has rose up to as much as 15-20% in commercial PV cells to 40% by using multi-junction concentrator solar cells. More and more researches are being done and various breakthrough are being made in current scenarios. Due to uprising of global warming in recent time many governmental and non-governmental organizations are looking into renewable energy resources with minimum or no after-waste, harnessing solar energy as much efficiently as possible and availability even in remote places has been prioritized.

Many interspace travelling spaceships, satellites, telescopes, probes, robots and so on have been using PV cells for operating purposes due to free and convenient availability of photons all over the solar system. Apart from extra terrestrial missions, a huge portion of energy is also being harnessed from sun to maneuver the electrical appliance: every year more than 20% is increased in using PV cells in order to generate electricity.

Currently, major market of PV cells market is dominated by wafer silicon-based modules where high purity and high-quality silicon is required. So, research for other materials instead of high quality and high purity silicon are being studied. Such ‘second generation’ solar cells of thin film absorbers such as Cadmium telluride (CdTe) are being extensively studied. CdTe is a direct gap thin film compound semiconductor so it is 100 times more absorbing than Silicon. Also, the cost of CdTe absorber layer is much lower cost than Silicon. This type of PV cells has 5-10% market currently.

As most of the sun’s ray is incident upon the side of the building most of the photons that could have been asserted to generate electricity is wasted. However, due to current physical appearance of solar panel adjusting them to side of building instead of glass is not possible for various reasons, so, a transparent solar cell to harness the photons incident upon the side of building without hindering the natural lights to enter in the building is being researched.

Manipulations to Capture Sun’s Solar Energy

Sun hits Earth with enough energy in about 40 minutes in Earth’s landmass to power the planet for a whole year. However, with the current technology it is impossible to harness with such efficiency. Albeit in the future, the occurrence of such a technology to harness such energy is feasible with enough resources. Currently, humans are not able to convert even 1% of total sun’s energy received by Earth.

As per Kardashev’s scale there are 5 types of civilization in the whole universe which is classified by use of energy harnessed by the host. With current condition, our civilization would not even rank Type-I; Type-I is the civilization to use and store all of the energy available on its planet. It is classified as Type 0.73. However, for being Type-II we need to harness whole of the energy emitted by sun i.e. 3.9 x 1026 watts. And for that purpose, a galactical superstructure known as Dyson Sphere has to be created to harness and store whole of the sun’s energy. A superstructure would be in itself pose a great challenge but for further advancement and harness the sun’s energy would be eventual outcome. Manipulating the sun’s ray and using that to our advantage would be beneficial for sustainable development.

There are more steps ahead in terms of manipulating and using solar energy. Thus, the future of solar energy is very promising and prominent not just for day to day activity but also for the advancement of human civilization. 

Potential of Solar Energy in Nepal

Solar energy (in the form of electromagnetic radiation) enters the earth’s surface. The wavelength of solar radiation entering the earth surface varies from 0.3-3 micrometer. Air molecules, aerosols and clouds absorbs and scatters the incoming solar radiation after it strikes the earth atmosphere. Out of the total radiation entering the earth’s surface about 70% of incoming radiation is engulfed by the atmosphere.

Looking back to the energy consumption patterns of the 50 years, the energy demands of the world has tripled because of advancement in technology and increase in number of developing countries. If the energy consumptions patterns remain same, in the next 30 years the energy demands would triple again. The current energy consumptions pattern has increased the energy crisis and would create problem in the energy security. So, the use of the renewable energy has been emphasized by most of the country. Germany, by the year 2020, had planned to meet its 20% electricity usage and 10% of their energy demand with the renewable resources. Many countries are making improvements in the renewable’s fields. Switching the energy consumption patterns from non-renewable to renewable energy would help in energy security and also reduce the carbon footprint and energy crisis.

The rate of consumptions of petroleum products in Nepal is increasing at the rate of 10% per year (source: NOC,2011).  Nepal lacks its own sources of petroleum and coal due to which its dependency with other country has increased, resulting the trade deficit. From the past six years regularly the price of the fossil fuel has been hiked. To break this dependency, promote long-term economic growth, tackle climate change, enhance global energy security and to assists in the development of the renewable field, it is essentials to make the use of solar energy. Solar radiation could be a major source of fuel in Nepal. Various research has been carried out to know the actual potential of the solar in Nepal. In Nepal, there are no continuous or long-term solar radiation results. However, the Royal Nepal Academy of Science and Technology (RONAST), in partnership with JICA, Japan, has conducted short-term solar radiation monitoring and utilization. In 1992 and 1995, they constructed 4 kW prototype and 40 kW solar photovoltaic panels for water pumping at Sunderighat, Kirtipur, and Bode Bhaktapur, respectively (Bhandari, 1996).

The total energy consumptions of the Nepal in fiscal year 2008/09 was found to be 410,000 TJ. According to the MOF, out of the total energy, 85% is covered by the traditional resources, 14% by commercial sources (coal-3%, grid electricity-2% and petroleum products-9%) and about 1% by alternative sources (solar power, wind, biogas and micro/pico hydropower). In average the global solar radiation varies from 3.6-6.2 kWh/m2 day in Nepal. In a year, for about 300 days, sun shines. The number of sunshine hours amounts almost 2100 hours per year and average insolation intensity about 4.7 kWhm-2 day-1 (=16.92 MJ/m2 day). In the world, Nepal is located in a favorable insolation zone. From 2008 to 2012, monthly sum global solar radiation for six sites is shown in the table below:

MonthBRTLUKLAKTMPKRJUMLASIMIKOT
JAN285.00475.33336.51379.67467.17404.59
FEB350.77460.95355.25413.62471.28381.86
MAR491.00520.74455.01517.97693.76446.99
APR538.72581.68508.90564.31684.19508.88
MAY583.40510.84537.65664.13781.36373.64
JUN518.16425.02496.89634.72749.16370.81
JUL475.18293.03444.18529.71619.68511.52
AUG435.32242.33414.78531.42595.99592.49
SEP446.34278.41405.85501.53657.801233.30
OCT454.12556.31424.69542.57620.88465.95
NOV 345.10505.50334.70389.50501.80436.80
DEC317.40438.50 311.00360.90436.50366.10

Monthly sum minimum global solar insolation was reported as 285 MJ/m2 in January for Biratnagar, 242.33 MJ/m2 in August for Lukla, 311.00 MJ/m2 in December for Kathmandu, 360.60 MJ/m2 in December for Pokhara, 436.50 MJ/m2 in December for Jumla and 366.10 MJ/m2 in December for Simikot, according to the data provided in above table. According to the above results, the lowest values of global solar radiation were reported in November, December, January, and February, which correspond to shorter days, the earth’s greatest distance from the sun, cloudy skies, and foggy days. The lowest value of minimum global solar radiation was 169.90 MJ/m2 in June 2008 at Kathmandu, which has the haziest, gloomy atmosphere, and rainy conditions (average rain fall 7.34 mm per day) (Source: DHM/GoN) of the Kathmandu Valley. The months of April to July have the highest solar insolation, while January, February, November, and December have the lowest. Jumla was discovered to be the place with the greatest amount of global solar energy. Nepal has a national average solar insolation of 4.66 kWh/m 2 day (16.776 MJ/m2 day). This value is higher than the 4.39 kWh/m2 day calculated by the Solar Energy Research Laboratory, Department of Physics, Silpakorn University, Thailand for Lao PDR, but lower than 5.1 kWh/m2 day, which represents selected high-potential Nigerian sites. According to the Solar and Wind Energy Resource Assessment (SWERA), solar energy is available in Nepal at an annual average of 4.7 kWh/m2/day (SWERA, 2006). According to this report, Nepal has a lot of solar energy. Plenty of the places in Nepal are solar radiation-friendly, which means that Nepal receives a lot of global solar radiation. As a result, Nepal has a high insolation level and a high solar energy capacity when compared to other countries. As a result, solar farming is strongly recommended in this country to address environmental, economic, and energy issues.

Nepal Future in Solar Harvesting

Nepal has faced a deficiency between the supply and demand of electrical energy for the past several years. Though the energy supplied by the Nepal Electricity Authority is more than 80% from the government and private hydropower sector. The deficit energy is purchased from India to meet the energy demand. Despite this, only 78% of the population has the access to grid-connected energy and 82% of the population used solid fuel as the source for cooking. So, the demand for energy is higher. The required demands for energy could be fulfilled if the proper utilization of the available renewable energy is properly planned and implemented. Nepal has the greater potential in renewable energy source in the form of solar energy. From the survey, it was found that the number of sunny days in Nepal is 300 days annually, which is the best platform for solar energy production.

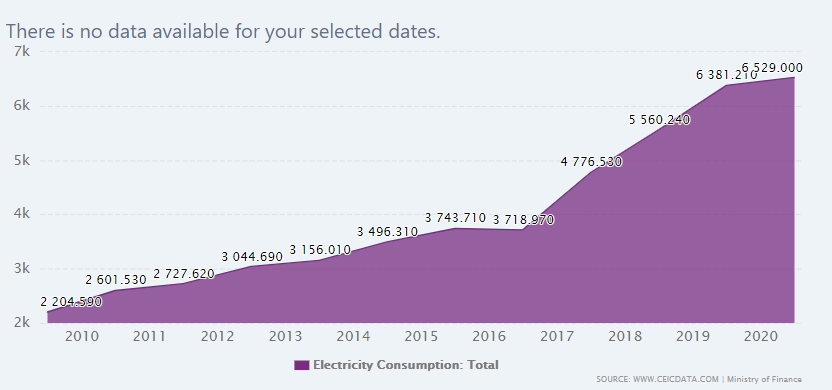
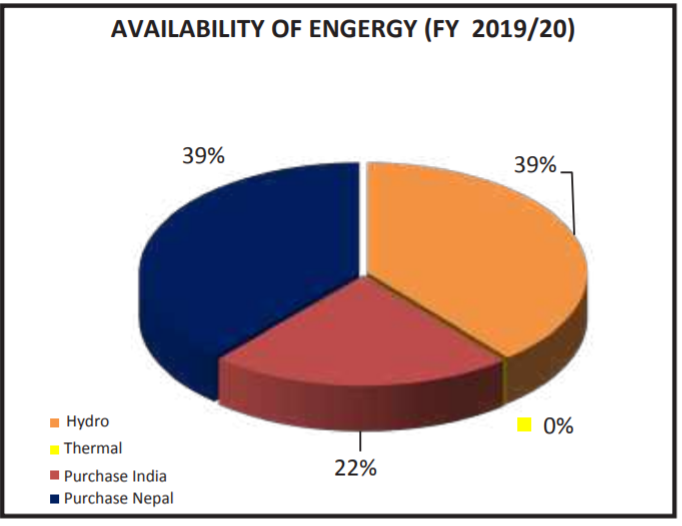
The above graph represents the energy consumption 2020in Nepal which was about 6529GWh. This consumption data was increased from 6381.21GWh from the year 2019. From the above graph,it is visible as the year passed theelectricity demand was higher. This is due to the adaptation of clean energy in cooking, heating, and so on as well as increased population and advancement in technology. Till today’s period, the country is not self-depended in the energy sector to meet the consumer demand of the country. The shortage of energy is purchased from India to meet its demand. According to the energy demand projected 2030 BS which was published by the Energy Department of the Government of Nepal in 2068 BS, the increased in energy demand from the various sector is rapidly increasing due to modernization and growth of population. By 2030 BS, the increase in the household will reached from 5.4 million to 7.7 million which indicates the large consumption of energy usage over time. It means, the energy consumption growth rate will increased from the various sector will be from4% to 19%. And the final energy demand will be around 3.817 gigawatt per years which is about 60% of the total system capacity.

From the chart of available energy, energy demand and forecasted data for the energy, it is seen that the energy demand for the coming year will be higher. This data clears the huge scope of renewable energyin the coming year as well. But due to the limitation and large investment along with geographical difficulties of Nepal it is very much difficult in the energy production from hydropower, wind, geothermal and other forms of energy. As the shortage of electrical energy increases more electrical energy need to be import from India which will result in large capital outflow from the national revenue. So the alternative is to prevent more capital outflow and in order to become self-dependent the country must look for alternative renewable resources for energy production. To meet the higher demand in all part of Nepal, solar harvesting will be the best possible option without hampering the natural resources.Peopleshas positive concept for the adaptation of PV solar for generating electrical energy from sun. And also, the Nepal government along with different INGO & NGOs is supporting better policies for the promotion and production of solar energy. According to the NEA annual report 2019, two projects related to solar are already connected in the NEA grid with a capacity of 1.68MW.

Solar photovoltaic system demand is increasing day by day as more people, INGO & NGOs are concerned with the preservation of natural resources and promoting renewable resources. And Nepal has a higher potential for solar energy. Also, solar energy production has a low cost as well as flexibility due to the decline in the cost of solarpannel due to advancement and bulk production of the system. Normally, Nepal holds the capacity to produced 50000 terawatt-hours per year from solar energy which is far larger than Nepal’s hydropower production and 7000 times larger than Nepal current consumption of energy.  It is cheaper than other sources of energy as hydro, nuclear, and fossil fuel. Solar PV is rated as the cheapest source of electricity in history in low-cost financing with a high-quality resource by the International Energy Agency. Other forms of energy increased climate change so current generation is seeking to reduce climate change andfor this, the solar PV is the best solution. Being a developing country Nepal can replace the fossils fuel era and adoptes the solar energy with zero-emission.

Solar energy is gaining more popularity due to the rapid fall in the cost associated with the system over recent years. For the production of solar energy, Nepal is good enough because with the investment of just NRs 4850 upto1MWh energy cab be produced. Moreover its cost will also decrease as the solar industry gets mature in Nepal. Hence, the solar energy can be considers the most reliable energy source in Nepal. Till the date, most of the individual household uses the small scale solar energy for computing, lighting, grain grinding, water pumping,telecommunication and so on. This energy can be adopted for the lower-income family as well as higher-income family to make their living easier. In the future, the Nepalese people can meet the higher living standard as well as can sell the surplus energy to the Nepal Electricity Authority and earnEXTRAmoney as well. It is predicted that when Nepal reach the developing countries, each individual of the country will consume about 15MWh per year of the total electricity. This is 70 times higher than today’s consumption.

Just like the developed country energy is used to heat and light the homes, power the electrical vehicle, cook food and also the operation of industries.

Most part of Nepal is feasible for the production of solar energy. Normally, a 40- 50 square meter area of the solar panel is required to cover the energy consumption per person to meet the normal power capacity which is about 10KW. Most of the area from the rooftop can be utilize, along with this some can float in the pond or lake or some can be on the ground.

Harvesting solar energy with proper management reduces the country energy crisis problem. We can use solar energy during the day time for the operation of industries and during night time we can run the hydro energy because pumped hydro energy storage is far cheaper than the other form of stored energy such as batteries. By balancing solar energy and hydro energy Nepal can get more benefit in the energy sector. As per the Global Pumped Hydro Atlas, Nepal has more good storage sites at about 2800 which is fifty times more than the needed even after Nepal catch up with the developed countries. Also, theses site doesn’t require to be dammed which reduce the high social and environmental cost associated with damping. Solar energy is cheaper and abundant in Nepal. If the government policies and proper management is adopted in the promotion and utilization of solar energy Nepal can take great advantagesof the energy sector. It reduced the energy cost as well as make the country self-depended in the energy sector. Nepal can enjoy the same energy consumption as the developed countries without degradation ofany natural resources such as burning fossil fuel or damping any river.

Grid Modernization: Beyond Smart Grid

The world is modernizing at such a rapid rate, everything has been upgraded from manual control to semi (nowadays mostly) automated systems. Such that electrical generation, distribution, and consumption is not far from this modernization. Hence, the Smart Grid concept has been introduced. Smart Grid (SG) does not have a unique definition to precisely describe the phenomena. However, the smart grid can be simply defined as an intelligent network that is automated and able to store, communicate, and make decisions. Different countries have different policies and concepts regarding smart grids but the integration of large-scale renewable energy, improvements in the reliability of services, and the achievement of higher levels of energy efficiency, etc. are common interests. The main need for the development of grid modernization is that the grids of today will not support the energy goals of the future. A few years back the challenge was producing sufficient energy supplies but now it is important to produce sufficient with minimal impact on the environment. ”The greener the better”, this concept has been prioritized.

Smart Grid Technologies

Numerous technologies can be implemented to achieve successful control and automation in smart grids. Such technologies are imperative to facilitate the transition toward a well-functioned

infrastructure from the perspective of grid designers and consumers. These technologies may include Automatic Voltage Regulation (AVR), Energy Management System (EMS), Automatic Generation Control (AGC), Advanced Metering Infrastructure (AMI), Meter Data Management (MDM), Distribution Management System (DMS), Geographical Information System (GIS), Outage Management System (OMS), Wide Area Management System (WAMS), and Demand Side Management (DSM).

Demand Side Management/Demand Response (DSM/DS)

Demand response has a vital role in shaping the future power grid in addition to the storage technologies, distributed generation, and communication infrastructure. Demand response can be classified into Price-based programs and Incentive-based programs. Attractive schemes can be launched hence, the changes in electric usage by consumers from their normal consumption behavior in response to new pricing schemes, elevated sense of responsibility, and incentive pricings that are mainly designed to induce lower electricity consumption during high price periods or when system reliability is jeopardized can be achieved.

Advanced DSM applications

  • Maintenance and outage planning
  • Retail power marketing
  • Distribution Simulation
  • Distribution power flow
  • Short circuit analysis
  • Optimal capacitor placement
  • Feeder relay protection coordination
  • Real-time DMS

Data Management

One of the main characteristics of Smart Grid is the Data Management system. It consists of various approaches for the management of data collected. Data collection can be done remotely or through real-time tracking. Different AI has been developed for real-time data tracking of Generation, Distribution, and Consumption.  It consists of various steps such as:

  • Data Collection
  • Data integration
  • Data Storage
  • Data Analysis
  • Data Visualization
  • Decision Making

Morden-day AI-based data management system allows online/on-time decision making. Several data loggers can transmit data in smart grids such as sensors data, power metrics data, mobile terminals, control devices, historical data, and reliability data. It saves a lot of time allowing the system to work a little faster and in a reliable manner.

Use of Smart Meter

The smart meters allow two-way communication between the end-users and the service provider. This enables consumers to control their energy usage and ensures more accurate billing. In addition, smart meters can provide power outage notifications and power quality monitoring. For a demand to be controllable, smart meters are often used since they possess a two-way communication that allows system operators or aggregators to effectively control loads. For instance, the ability of smart meters to control domestic demands for frequency regulation purposes. Hence, Smart Meter is a game changing device developed  ensuring the future Grid modernization beyond Smart Grid.

Advantages

  • Time-saving.
  • Improve the reliability and quality of the infinite grid.
  •  Optimize the smooth operation of the existing setup reducing the future expansion of backup plants.
  •  Increases the overall system efficiency.
  •  Improves cooperation of Distributed Resources.
  •  Enable automatic maintenance
  •  Lower greenhouse gaseous emissions.
  •  Improvement of the system to ensure and enhance system security

Challenges and Drawbacks

Every system or its development has its drawbacks and challenges. Battery backup systems and cybersecurity can be the major threats to the grid modernization system. Energy Storage Systems are fundamental parts when it comes to renewable energy resources integrated into smart grids. The application of energy storage is not new, yet the technologies require further developments. Their operation and size need to be carefully optimized.

The advanced automation and communication capabilities in smart grids expose the entire system to cyber threats. The consumer’s data are in constant threat and can be achieved by any person at any time. Therefore, the data need to be encrypted to avoid future threats.

Conclusion

According to various research articles, the paper published, and attended webinars, the future of modernization in the smart grid is the developed AI that facilitates two-way communication at every point of the system if possible.

Some of the important findings are listed below:

  • Development of optimized battery size and service.
  • Achievement of improved Cyber Security System.
  • Need of integrated energy system with renewables like solar, wind, etc. for the reliable power source
  • Smart generation, smart distribution, and smart consumption should be achieved.
  • Need for development of more advanced AI.
  • Automation and Visualization.
  • Test, Test, and Test as there would be more time-consuming changing the system.
  • Two-way communication from every point is necessary.
    • Communication between Generation and Consumption
    • Communication between Generation and Distribution
    • Communication between Distribution and Consumption

Hence, if there is proper communication between the different systems then reliability in the power supply can be achieved. Problems that arose can be solved in less time and there won’t much hamper to the whole system and consumers.

Environmental Impacts of Solar Photovoltaic System

The annual increases in global energy consumption, along with its environmental issues and concerns, are playing significant roles in the massive sustainable and renewable global transmission of energy. Solar energy systems have been grabbing most attention among all the other renewable energy systems throughout the last decade.

Since PV technology generates electricity directly from solar energy, it is free from fossil fuel consumption and greenhouse gases (GHG) emission during its operations. Thus, it seems to be completely clean and have no environmental impacts. However, during its life cycle, it actually consumes some energy and emits GHG during some stages such as solar cells manufacturing processes, PV module assembly, Balance of System (BOS) production, material transportation, PV system installation and retrofitting, and system disposal or recycling. These are the stages where solar actually has an environmental impact.

Life cycle assessment (LCA) is usually conducted to accurately investigate the environmental performance of PV systems. LCA is a methodology for assessing environmental impacts associated with all the stages of the life-cycle of a commercial product, process, or service. The following table shows the breakdown of lifecycle greenhouse gas emissions for PV in total percentages.

Table 1: Breakdown of lifecycle GHG emissions for solar PV and wind energy (% of total)

Energy  SourceFabricationConstructionOperationDecommissioning
Solar PV71.3%19%13%-3.3%
Wind71.5%24%23.9%-19.4%

It is evident from the table that fabrication is responsible for the largest share of emissions, followed by construction and operation.

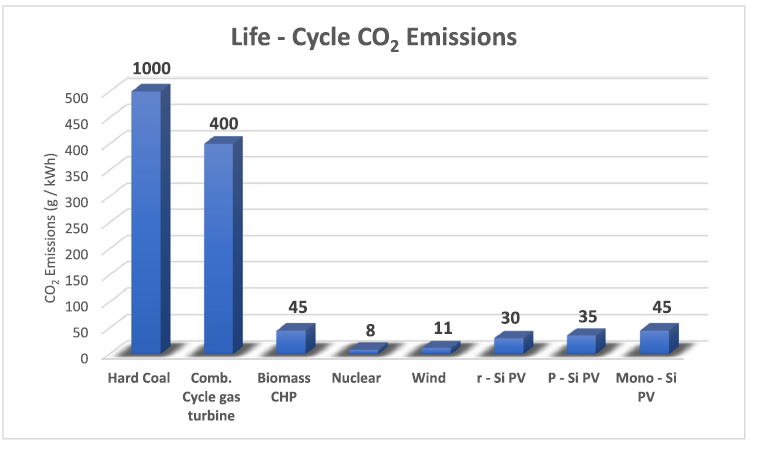
The following figure shows the life cycle CO2 emissions of conventional energy supplying technologies and some renewable energy sources and compares them to the Mono-Si, P\\Si, and r-Si PV technologies.

Life Cycle CO2 emissions comparison between PV technologies and other energy supplying technologies
(Alsema and deWild, 2005).

EPBT (Energy Payback Time) is regarded as a perfect evaluation indicator for sustainability through which we can clearly determine whether the specific PV system can bring a net gain of energy for the user during its lifetime and if so to what extent. The EPBT indicator is defined as the years required for a PV system to generate a certain amount of energy (converted into equivalent primary energy) for compensation of the energy consumption over its life cycle, including energy requirements in PV modules’ manufacturing, assembly, transportation, system installation, operation and maintenance, and system decommissioning or recycling.

In 1970, the average energy payback time for solar panels was 40 years. By 2010, that number had dropped to just six months. With technological advancements, solar panels are being more efficient which means that solar’s EPBT will continue to decrease.

Impacts to air

The impact of PV energy on air quality and climate change is significantly lower than any other traditional power generation system. Hence, it can assist in eliminating numerous environmental issues that resulted from utilizing fossil fuels. PV systems have zero emissions of carbon dioxide (CO2), methane(CH4), sulfur oxides(SOX), and nitrogen oxides(NOX) during operation with negligible effects on air pollution and global warming.

It is also estimated that the use of PV systems can lead, by the year 2030, to a reduction of CO2, SO2 and NOX emissions by around 69–100 million tons, 126,000–184,000 tons and 68,000–99,000 tons, respectively. These reductions in emissions are projected to lead to a significant drop in several dangerous diseases such as heart attacks and asthma that are expected to decrease by 490–720 and 320–470 annually, respectively.

Land use

Typically, the land requirements for solar projects are larger than conventional fossil fuels’ projects. Utility-scale solar power plant requires large areas for energy production. Due to this, the facilities may interfere with existing land uses and can impact through material exploration, extraction, manufacturing and disposal. Several reports and studies show that solar power systems (PV and Concentrated solar power (CSP)) have the highest energy land use intensity compared to other energy technologies. Table 2: Land requirement for various sizes of solar and wind technologies.

Technology TypeSize (acres/MW)
PV <10 kW3.2
PV 10100 kW5.5
PV 1001,000 kW5.5
PV 110 MW6.1
Small PV (>1 MW, <20 MW)5.9
Fixed5.5
1-axis6.3
2-axis flat panel9.4
2-axis Concentrator photovoltaics (CPV)6.9
Large PV (> 20 MW)7.9
Fixed5.8
1-axis9.0
2-axis flat CPV6.1
Small and large PV installations2.2–12.2
Small and large CSP installations2.0–13.9
PV panels installed in parallel6.1
PV parks8.1
Wind <10 kW30
Wind 10 100 kW30
Wind 100- 1000 kW30
Wind 1 10 MW44.7

However, certain technologies have been developed to reduce land use without compromising the efficiency of solar system such as a dual-angle solar harvest system a two tilt angle solar array. To avoid the conflict with agricultural land, PV systems can be installed in degraded areas, deserts and no cropping land. Land use can be also reduced by employing floating PV (FPV) systems. In FPV systems, the PV panels are laid on top of a structure that floats in a water body. FPV systems are found to be more efficient than inland PV systems because of the continuous cooling caused by water evaporation at the back of FPV panels. Another advantage of using FPV is decreasing the water losses from freshwater bodies.

Water usage

The water consumption in PV systems during operation is insignificant. During operation, water is used mainly for panels cooling and cleaning. The water consumption during the manufacturing and recycling processes is considerably higher than the water consumption during operation.

Other technologies such as nuclear, natural gas, coal-fired facilities, all require massive amounts of water for cooling purposes. Solar energy imposes no risk to local water resources, nor their operation strains local supplies by competing with agriculture, drinking systems and other vital water needs.

The results showed that photovoltaics has the lowest footprint in water usage compared to other renewable technologies as depicted in Table 3.

Table 3: Median of water consumption in a full life cycle for different energy generation technologies.

Energy TechnologyMedian of Water Consumption
(L/MWh)
Biomass85,100
Hydropower85,100
Oil3,220
Nuclear2,290
Coal2,220
CSP1,250
Geothermal1,022
Natural Gas596
PV330
Wind43

Noise

PV modules do not contain moving or rotating parts, hence, there is no significant noise pollution produced during their operation. However, during the construction phase, many heavy machinery and vehicles operate on the site which causes noise pollution for residences, travelers, and wildlife.

PV systems not only impose zero noise pollution to the environment but also can be used as noise barriers (NB) which helps in mitigating noise. These are usually top-mounted near highways and provide the dual combination of combating noise while providing electricity. Configurations are shown in the figure below.

Different possible PVNB configurations

Hence we can conclude that the environmental impact of solar energy is net positive and have minimal impact compared to other energy generation technologies. PV in general emits no GHG during its operation. Electricity generation with solar energy instead of coal and other sources can significantly reduce greenhouse gas emissions resulting a better and cleaner environment. Although it emits some GHG during some stages of its life cycle, the total GHG emitted during its whole life cycle is the least compared to other sources of energy. Further, researchers are investigating many improvement approaches to lower the PV carbon footprint. This can be achieved by adopting best practices in design and deployment phases that lead to better performance and reduce the overall emissions. Some attributes such as: increase lifespan; increase system capacity; increase irradiance (desert); use of renewable energy mixes and thin-film (CdTe) or cadmium selenide (CdSe) quantum dot PVs, should be taken in consideration to reach the lowest gases emission levels.

References

M. Tawalbeh, A. Al-Othman, F. Kafiah, et al., Environmental
 impacts of solar photovoltaic systems: A critical review of recent progress and future
 outlook, Science of the Total Environment (2020)
 Malek Kamal Hussien Rabaia, et al., Environmental impacts of solar energy systems: A review, Science of the Total Environment (2021)
 https://news.energysage.com/what-is-the-environmental-impact-of-solar-energy/